To cite, please include the following: The Program on Health Workforce Research and Policy at the Cecil G Sheps Center. “NC Nursecast: A Supply and Demand Model for Nurses in North Carolina.” November 1, 2021. https://ncnursecast.unc.edu/documentation/
The NC Nursecast Supply & Demand Model is an interactive,
web-based tool that forecasts the future supply and demand for
Registered Nurses (RNs) and Licensed Practical Nurses (LPNs) in various
practice settings in North Carolina. The model is based on historical
nurse licensure data, state population data, and health care survey and
discharge data, as well as expert input from a nursing advisory
committee. These sources were used to develop baseline estimates of how
many nurses NC will have and how many nurses NC will require from
2019-2033, based on historical utilization patterns by region and
practice setting. The model also provides alternative scenarios to
explore the potential outcomes if nurses leave practice earlier than
expected, if more students graduate from nursing programs, or if fewer
nurses come to NC from outside of the state.
The NC Nursecast Graduate Diffusion tool is a separate interactive,
web-based tool that allows users to see where students in NC’s nurse
training program practice after graduating. That tool shows the percent
of each program’s graduates working in North Carolina, the percent
employed in different settings, and the percent located in rural areas.
Note that the NC Nursecast tools do not currently include Advanced
Practice Registered Nurses (APRNs) such as Certified Registered Nurse
Anesthetists (CRNAs), Nurse Practitioners (NPs), or Certified Nurse
Midwives (CNMs).
Methods: NC Nursecast Supply and Demand Model
Data Sources
Supply Data:
The supply model uses licensure data obtained from the NC Board of
Nursing (NC BON) for 2015 through 2018, for all RNs and LPNs licensed in
the state. These data are collected as a part of the biannual license
renewal process and represent a complete census of NC nurses. These NC
BON data are housed in the NC Health Professions Data System (HPDS) at
the Sheps Center and include demographic, education, practice, and
location variables needed in the supply model described below.
Demand Data:
The demand model uses different data sources to model aspects of demand
that are relevant to each given setting as set out in this table:
Setting
Data source
Hospital
NC Discharge data 2013 to 2017 for:
Inpatient
Hospital outpatient
Emergency
Ambulatory Care
National Ambulatory Medical Care Survey (NAMCS) data from 2011 to 2016 for Southern Region States only
Nursing Home
Residency information from NC Nursing Home licensure data for 2019
Due to incomplete data on the originating location of nursing home residents, data for nursing home forecast is based on location of the nursing homes
Mental Health
Mental Health cases reported in Medical Expenditure Panel Survey (MEPS) for 2017 for Southern States
Home Health
Home Heath visits reported in Medical Expenditure Panel Survey (MEPS) for 2017 for Southern States
Employment Setting Details
The model includes the following eight practice settings: (1) hospital,
(2) ambulatory care, (3) nursing home, extended care and assisted living
facilities, (4) home health/hospice, (5) community and population
health, (6) academic settings/nursing education, (7) mental health, and
(8) correctional facilities. These data are based on self-reported
category choices by NC nurses at the time of licensure renewal with the
NC Board of Nursing.
Self-reported practice settings can be inconsistent because nurses are
not provided with direction on the licensure form about to categorize
themselves into different employment settings.
We did not model every possible practice setting, and this model also
assigns each nurse to a single practice setting, even though some nurses
split their time between multiple settings. The licensure data only
captures the practice setting in which the nurse is working at the time
of biannual licensure renewal, not every setting the nurse worked within
over the course of the preceding two years.
Additional setting-specific methodological notes:
Community and population health
Includes nurses who reported practice settings of “Community
Health,” “Occupational Health,” “Public Health,” and “School
Health Service.”
Mental Health
Nurses working in mental health settings could not be identified
from practice setting selection options, so we used
nurse-reported specialty and employer name to categorize these
nurses.
Nursing Education
For nurses reporting “Academic Setting” as their practice
setting, we conducted an additional review of employer names to
identify the subset who worked within nurse training programs.
It was this subset that we labeled as working in the setting
“Nursing Education.”
Modeling Details
NC Nursecast’s supply and demand model includes four key elements:
A supply model, which estimates how many nurses will be
available in North Carolina in the future, based on current trends.
A demand model, which estimates how many nurses will be required
in North Carolina in the future, based on current trends.
Estimates of future nursing workforce shortages or surpluses in
North Carolina, calculated by combining the supply and demand
models.
Alternative supply scenarios which estimate future nursing
workforce shortages or surpluses if current trends change: if nurses
accelerate or delay retirement, for example, or if nursing schools
increase class sizes.
See details on each, below.
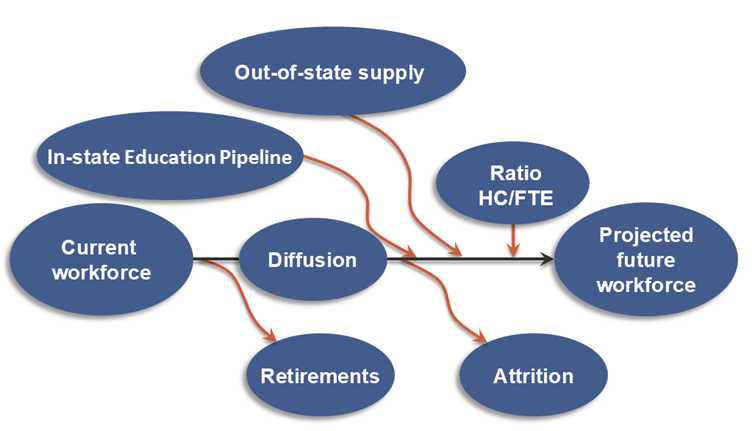
1. The Supply Model
The supply model projects the future headcount and FTE of RNs and LPNs
from 2019-2033. The basic approach in this model, as in any workforce
supply model, is to take the current workforce, subtract “leavers”
(nurses who retire, leave the workforce, or move out of state) and add
“joiners” (newly-trained nurses or nurses who moved into the state) for
each year to generate a forecast for the next year. The approach is
summarized visually below:
Figure 1: Supply Model for Estimating North Carolina RN and LPN workforce, 2019-2033
The supply model is based on an agent-based microsimulation. This
involves creating a “synthetic” version of the North Carolina nurse
workforce (based on the characteristics of the actual workforce),
applying assumptions based on current leaving and joining trends, and
performing many repeated computer simulations of possible trajectories
of the individual synthetic nurses based on their age, nurse type (RN or
LPN), degree (ADN, BSN, or LPN), gender, and employment setting
(hospital, ambulatory care, nursing home, extended care and assisted
living facilities, home health/hospice, community and population health,
academic settings, mental health, and correctional facilities).
For more details on these employment settings, see the “Data Sources”
and “Employment Setting Details” sections, above.
Limiting Analysis to RNs and LPNs
NC Nursecast includes RNs and LPNs. Advanced Practice Nurses— nurse
practitioners (NPs), certified nurse midwives (CNMs), and certified
registered nurse anesthetist (CRNAs)—are excluded from the model.
However, because APRNs are licensed as RNs in NC, we needed to develop a
method to exclude them from the data used by the model.
NPs and CNMs with an active practice agreement in NC were identified as
APRNs. CRNAs and CNSs self-report their roles in the licensure data.
NPs, CNMs, and CRNAs in active practice in North Carolina were removed
from the RN workforce data. However, CNSs remain in the model because of
the significant overlap between RN and CNS roles. NPs reporting an
active RN practice location but not an active NP practice location
remain in the RN workforce data. APRNs who are not currently practicing
as an APRN also remained in the RN workforce modeled.
Modeling Geographic Mobility
Based on licensure data between 2015 and 2018, the probability of a
nurse changing settings and geographic location was calculated. The
model uses these probabilities to estimate whether an individual nurse
changes his or her geography and setting in each year of the forecast.
2. The Demand Model
Demand was modeled at the county level for each employment setting.
There is significant variation in the data available for measuring
existing demand in different employment settings, so we used several
different approaches for calculating future demand.
For community and population health, nursing education, and correctional
facilities, the demand forecast is dependent on population change (which
means, for example, a 10% growth in a county’s population would generate
a 10% growth in the demand forecast for these settings in that county).
For the remaining settings, we developed separate regression models to
forecast demand based on predictors such as gender, age, and
race/ethnicity.
For ambulatory care settings, there has been an increase in the number
of nurses working in this setting, much of which as a result of nurses
undertaking new roles in ambulatory care rather than an increase in
total demand for ambulatory care. Therefore, to forecast ambulatory
demand based on changes in population alone will not reflect the
expected continued increase in ambulatory care nurses. Following input from chief nursing officers and nursing leaders in ambulatory care, it was agreed that the model would continue the historical increase in ambulatory care nurses until 2023, between 2023 and 2025 there is a smoothed transition to demand driven by population growth which is used beyond 2025.
Forecasts of future demand were then generated using the population
forecasts from the NC Office of Budget and Management to model the
effect that population growth and the changing composition of the
population by age, gender, and race would have on demand. Non-population
forecast data such as percent insured was assumed to be constant and
remains unchanged for all years.
Demand for future visits depending on setting were converted to demand
for FTE by using the ratio of visits to FTE in 2018 for all future
years. For example, a 10% increase in demand for ambulatory visits is
modeled as a 10% increase in demand for ambulatory nurse FTEs from the
baseline of 2018.
Demand forecasts by headcount were estimated by using the average
headcount to FTE ratio for a given setting.
The model aggregates the county-level results to produce forecasts of
demand at the Area Health Education Center (AHEC), Medicaid , and
Metro/Non-Metro regions. A crosswalk of counties to these larger units
of geography is available.
3. Estimating Shortage and Surplus
Like most other workforce models, NC Nursecast assumes that in 2018
demand is matched by supply - neither a shortage nor a surplus. This
assumption was made due to the lack of data to reject this assumption,
as vacancy data are not collected in a consistent way for North
Carolina. The one exception is for RNs in nursing education for which
vacancy data were available. The data indicated a 7% shortage in FTE in
2018, which was incorporated into the model with demand exceeding supply
by 7%.
Confidence Intervals
Confidence intervals are used to convey the uncertainty in the forecast
and to provide an estimated range around a predicted value. As a
comparison, it is generally accepted that the forecasting of a hurricane
trajectory has a degree of uncertainty in that the farther the forecast
goes into the future, the less certain the path of the hurricane.
Workforce modeling has a similar degree of uncertainty generated by
minor changes within a year that over time have a cumulative effect. To
model this, the multiple iterations of the scenario are completed,
within each iteration there will be variation in, for example, the year
a nurse leaves the workforce, which means each iteration will generate
slightly different forecasts. The calculation of 95% confidence
intervals takes into consideration the cumulative effect of individual
variation of iterations of a scenario.
4. Modeling Alternative Supply Scenarios
The baseline model assumes that the factors affecting the supply and
demand for nursing services in 2019 will continue as they have in prior
years. Yet, we know that nursing workforce participation patterns,
models of care, and other factors are likely to change. To account for
these deviations from the current status quo, we modeled five
alternative future scenarios known to affect supply and demand:
Early exit from the workforce by 2 years: nurses leave the workforce
two years earlier than they would have based on historical data,
with all nurses retiring by age 68
Early exit from the workforce by 5 years: nurses leave the workforce
five years earlier than they would have based on historical data,
with all nurses retiring by age 65
Delayed exit from the workforce by 2 years: nurses delay leaving the
workforce by two years, although all nurses still retire by age 70
Reduction in out-of-state supply by 2.5%
Increase in NC new graduate nurse supply by 10%
We also modeled a sixth scenario that combines three of the five
scenarios and reflects a situation that could occur together given some
early indicators of the current NC nursing environment and the COVID-19
pandemic:
Combined scenario: nurses exit the workforce five years earlier than
they would have, with all nurses retiring by age 65 + a reduction in
out-of-state supply by 2.5% + an increase in NC graduate supply by
10%
Do these Scenarios Estimate the Effects of COVID-19?
The alternative supply scenarios were developed prior to the COVID-19
pandemic, but they can be used to illustrate some possible types of
pandemic-related workforce effects. For example, the “early exit”
scenarios might inform discussions about burnout, and the “increase in
graduate supply” scenario could reflect a pandemic-related “hero
effect” that motivates students to pursue careers in nursing. A
combination scenario of early exit + decreased out-of-state supply +
increased graduate supply is available to visualize the combined
effects of these scenarios that might occur together due to the
pandemic. Note, again, that the magnitude of any COVID-19-related
changes is still unknown, but these scenarios can provide a starting
point for discussion.
Supply & Demand Model Terminology and Calculations
Supply: The supply model projects the future headcount and FTE
of RNs and LPNs from 2018-2030.
Demand: The demand model projects the future headcount and FTE
of RNs and LPNs from 2018-2030.
Supply-Demand by FTE: The absolute difference between the supply
and demand forecasts, calculated as supply minus demand for a given
year. This calculation provides an estimate of the absolute number
of nurses in surplus or shortage.
% Surplus or Shortage: The percentage shortage or surplus of
supply relative to the demand forecasts. When this percentage is
negative, it means demand is greater than supply. The calculation is
useful for understanding the relative surplus or shortage for a
projection.
Methods: Graduate Diffusion Tool
North Carolina has over one hundred nursing programs. Some programs
educate licensed practical nurses (LPNs) while others educate registered
nurses (RNs) and award an associate’s or bachelor’s degree. Where do
these nurses go after they have graduated and how do the patterns of
diffusion differ between different types of programs and individual
programs?
To help answer those questions, we use licensure data to determine where
a nurse completed their first nursing degree for licensure and where
they were working two years later. Then we put those origin and
destination points on a map for each of North Carolina’s nursing
programs. We drew an ellipse around those points to show the spatial
distribution of approximately 2⁄3 of the graduates from each program,
giving a general idea of the diffusion pattern of a school’s graduates.
Data Sources:
The in-state retention data available in the tables comes from NC
Tower, which provides aggregate information on
students who attended public universities and community colleges in
North Carolina. Therefore, only public institutions have a retention
value listed.
Web Model Interface Details
The website and data visualizations are built using a variety of
open-source software, most notably the D3 data visualization library,
the JavaScript framework Svelte and the JavaScript bundler Rollup. The
nurse diffusion map also makes heavy use of the Mapbox GL JS JavaScript
library. Most of the website style (i.e., CSS) is defined using Bulma, a
CSS framework. The website is composed and generated using Hugo.
The data are housed on a server provided by Carolina CloudApps within a
container running Node.js. The main job of this server is to pass data
from a mySQL database to the user interface. The database is loaded with
precalculated projection data for all the parameter combinations in the
visualizations.
Definitions
Advanced Practice Registered Nurse, APRN
A registered nurse (RN) who has completed additional master’s or
post-master’s level education in a specialty area. APRNs include nurse
practitioners, certified nurse midwives, certified registered nurse
anesthetists, and clinical nurse specialists. APRNs are excluded from
the NC Nursecast RN supply model.
Area Health Education Center (AHEC) Regions
North Carolina’s Area Health Education Center
Program is a statewide program to develop the
state’s healthcare workforce, which is administered through nine regions
made up of adjacent counties. Each region has its own AHEC center
focused on the unique workforce needs of the region.
Full Time Equivalent, FTE
One of two ways to count a workforce (see
headcount). Each nurse is counted as a
proportion of full-time based on the number of hours they work. Our
model defines full time as 40 hours per week. For example, a nurse may
only work as a nurse for 4 hours per day on Monday through Thursday, a
total of 16 hours and an FTE of 0.4 (16/40). The other way to count is
by headcount. We modeled FTE in the probabilistic model based on the
mean and standard deviation of hours worked as a function of age,
gender, and employment setting using NCBON
licensure files which contain self-reported average hours worked per
week in nursing.
Headcount
One of two ways to count a workforce (see full time
equivalent). Each nurse is counted as 1.0 regardless
of whether they are full or part time.
Licensed Practical Nurse, LPN
A nurse who has completed a practical or vocational nurse education and
clinical training program (approximately 12-18 months in duration),
passed a licensure exam, and completed licensure with a state board of
nursing.
Medicaid Region
North Carolina launched the NC Medicaid Managed Care model on July
1, 2021. To administer the program, the NC Department of Health and
Human Services has divided the state into five regions. Forecasting
demand at this level is particularly useful when looking at the
demand of the Medicaid beneficiary population.
Metropolitan
A county that contains a core urban area of 50,000 or more people, as
defined by the United States Census Bureau and the Office of Management
and Budget. Typically, this designation is used to define counties that
are urban or not rural. This model uses the 2017 vintage of the county
delineation file in which 46 counties in North Carolina are
metropolitan. See non-metropolitan.
Non-metropolitan
A county that does not contain a core urban area of 50,000 or more
people, as defined by the United States Census Bureau and the Office of
Management and Budget. Typically, this designation is used to define
counties that are rural. This model uses the 2017 vintage of the county
delineation file in which 54 counties in North Carolina are
non-metropolitan. See metropolitan.
Registered Nurse, RN
A nurse who has typically completed either a two-year postsecondary
degree (an Associate’s Degree in Nursing, or ADN), a diploma in nursing
(typically 18-32 months of training offered by a hospital), or a
four-year postsecondary degree (Bachelor of Science in Nursing, or BSN),
passed a licensure exam, and completed licensure with a state board of
nursing.
>
Explore
Supply & Demand
Want to learn about the future supply and demand of our state's licensed practical
nurses and registered nurses across settings and geographic regions?
This project is brought to you by The Cecil G. Sheps Center For Health Services Research at the
University of North Carolina in partnership with the North Carolina Board of Nursing.