To cite, please include the following: The Program on Health Workforce Research and Policy at the Cecil G Sheps Center. “NC Nursecast: A Supply and Demand Model for Nurses in North Carolina.” November 1, 2021. https://ncnursecast.unc.edu/briefs/settings/
Registered Nurse (RN) Supply and Demand.
By 2033, North Carolina
faces an estimated shortage of 12,459 RNs (or 11% of the projected RN
workforce) across all settings, but there is significant variation by
setting. Hospitals will experience the largest shortage of RNs in terms
of absolute numbers by 2033, and nursing home/extended care/assisted
living settings will face the largest shortage relative to their
projected workforce supply (Table 1).
Table 1. Projected Registered Nurse Workforce Shortage in 2033 by Setting
Setting
2033 Workforce Shortage/Surplus (# of RNs)
2033 Workforce Shortage/Surplus (% of RNs)
Hospital
-9927
-16.7%
Nursing Home/Extended Care/Assisted Living
-1888
-30.8%
Home Health/Hospice
-1535
-17.9%
Nursing Education
-132
-8.9%
Correctional Facility
-128
-15.7%
Mental Health Hospital/Facility
-26
-0.9%
Community and Population Health
+86
+1.4%
Ambulatory Care
+363
+2.3%
Source: NC Nursecast. https://ncnursecast.unc.edu/. Represents Total RNs in the state by headcount for all settings combined at the baseline projection.
Licensed Practical Nurse Supply and Demand.
By 2033, the state is
expected to face a shortage of 5,044 LPNs, which represents a 26.8%
shortfall in future LPN supply relative to demand. Unlike RNs, who are more likely to be employed in hospitals, the greatest number of LPNs are employed by nursing home/extended care/assisted living facilities, and these settings are forecast to face a nearly 50% shortage of LPNs by 2033. As LPNs leave hospital employment, hospitals will also face a large percentage shortfall (31.7%) of LPNs by 2033 (Table 2).
Table 2. Projected Licensed Practical Nurse Workforce Shortage in 2033 by Setting
Setting
2033 Workforce Shortage/Surplus (# of LPNs)
2033 Shortage/Surplus (% of LPNs)
Nursing Home/Extended Care/Assistive Living
-3510
-49%
Home Health/Hospice
-504
-14%
Hospital
-314
-31.7%
Ambulatory Care
-148
-6.7%
Mental Health Hospital/Facility
-58
-9.4%
Correctional Facility
-9
-2.2%
Source: NC Nursecast. https://ncnursecast.unc.edu/. Represents Total LPNs in the state by headcount for all settings combined at the baseline projection.
Shortages of Nurses by Setting in Different Regions of North Carolina.
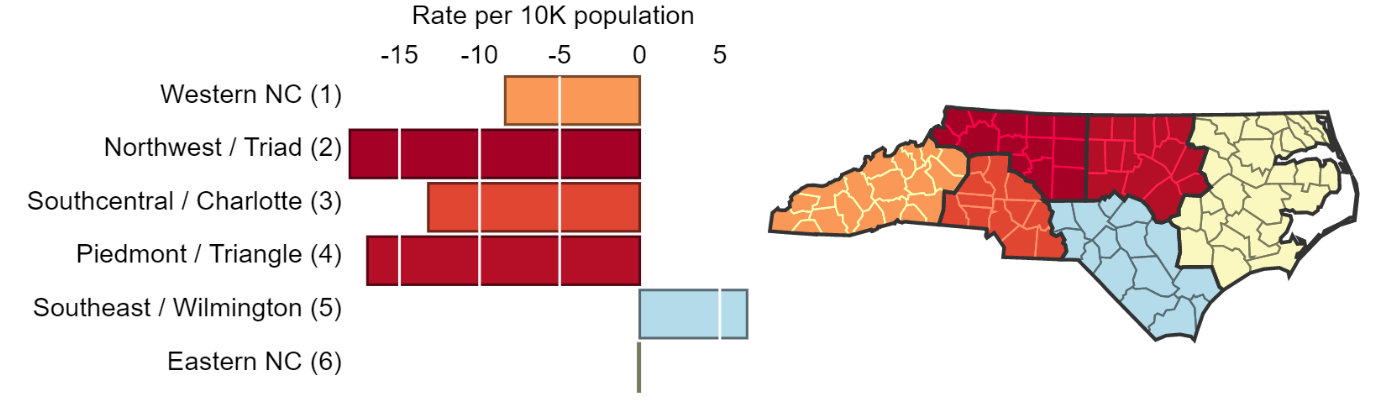
A powerful feature of NC Nursecast is the ability to examine workforce forecasts by setting and by region, including Medicaid, AHEC, and rural regions of the state. Not surprisingly, RN shortages will be greatest in areas of North Carolina with large and growing hospitals and health care systems—the Piedmont/Triangle and Northwest/Triad regions. Eastern NC essentially holds steady at neither a shortage nor surplus, and the Southeast/Wilmington region is projected to have a slight surplus (Figure 1). This surplus is likely because RN programs in that area have some of the highest retention rates in local communities, with a high percentage of their nurses practicing in rural areas.
Figure 1. RN Shortage/Surplus per 10K Population, All Settings, by Medicaid Region
Source: NC Nursecast. https://ncnursecast.unc.edu/. Represents Total RNs in the state by headcount for all settings combined at the baseline projection.
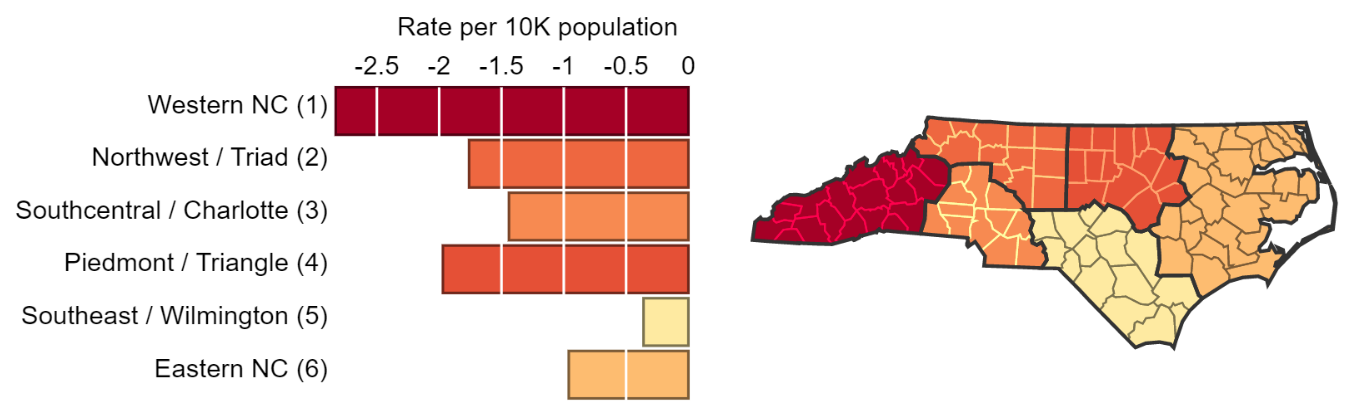
The story looks different for other employment settings. Western NC
(Medicaid Region 1) will face a larger per capita shortage of RNs in
nursing home, extended care, and assisted living facilities compared to
other parts of the state (Figure 2).
Figure 2. RN Shortages/Surplus per 10K Population in Nursing Home/Extended Care/Assisted Living, by Medicaid Region
Source: NC Nursecast. https://ncnursecast.unc.edu/. Represents RNs by Medicaid region, by headcount rate per 10,000 of the population for nursing home/extended care/assisted living at the baseline projection.
Regional Differences Explained.
Regional differences exist because
the NC Nursecast model incorporates the unique characteristics of RN and
LPN supply in different parts of the state: the supply and age profile of
nurses in the region, the number of educational programs in the area and
their likelihood to produce graduates for local employers, and the
historic trends of nurses moving into communities. The model also
accounts for regional differences in the demand for RNs and LPNs,
including factors like the projected population growth in the area and
changing population demographics that will drive the demand for
different types of health care services in various regions. NC Nursecast allows stakeholders—employers, educators, elected officials and other stakeholders to see important regional differences in the future supply and demand of RNs and LPNs and how they compare to state-level trends.
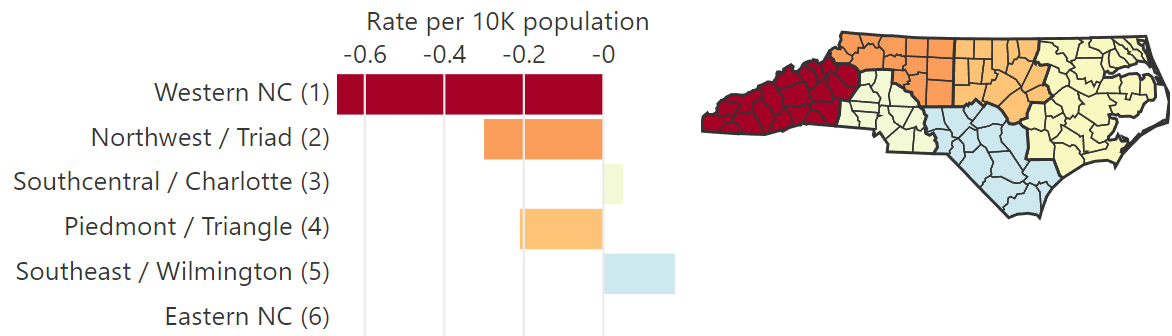
Surprise Finding – Ambulatory Care.
NC Nursecast projects that
ambulatory care settings will experience an almost 7% shortage of LPNs
at the state level in 2033. Ambulatory care shortages vary by Medicaid
region (Figure 3) with some areas of the state forecast to experience a
slight surplus of LPNs in ambulatory care. The projection of a surplus
in ambulatory care may seem surprising but the supply of LPNs in North
Carolina’s ambulatory care settings has increased dramatically in the
past few years. Between 2015 and 2018, the number of LPNs in ambulatory
care increased 47% compared to a 21% decline in the supply of LPNs in
hospitals, and a -6% decrease in LPN supply in nursing homes, extended
care, and assisted living facilities.1
Figure 3. LPN Shortages/Surplus per 10K Population in Ambulatory Care, by Medicaid Region
Source: NC Nursecast. https://ncnursecast.unc.edu/. Represents LPNs by Medicaid region, by headcount rate per 10,000 of the population in ambulatory care at the baseline projection.
Careful consideration must be given to interpreting setting forecasts.
Although some settings are forecast to face relatively
small shortages or even surpluses of RNs and/or LPNs, careful
consideration must be given to interpreting these data because they may
reflect other factors such as chronic underfunding, low pay, a lack of
desirability of the setting or region, as well as barriers such as a local lack
of insurance coverage. The forecasts presented in this brief are based
on the historical utilization of LPNs and RNs (per population) in
different employment settings, not the number of LPNs and RNs that would
be needed to fully meet patients’ needs for care or fill all position
vacancies. This is a classic problem in workforce modeling because the true
need for health professionals can look very different than “realized”
demand.2
For example, the model suggests that nursing education will experience a
9% shortage, or an estimated 132 headcount shortfall, of nurse educators
by 2033. To educators, this shortage may seem small compared to what
they feel is needed to fill vacancies generated by growing faculty
retirements and increasing enrollments. However, growing wage
disparities between nurses employed in academic settings and clinical settings
make it difficult to recruit nurses to and retain them in academia, thus
suppressing demand in academic settings.3
Similarly, RNs employed in community and population health settings—a
category that includes nurses who provide care in community-based
settings including public schools, public health departments,
occupational health, and other community care centers—are projected to
have a balance between supply and demand. However, this balance
represents the historical utilization of nurses in these areas, and not
necessarily the need for them. The demand for community and population health
nurses is much lower than expected because these settings are
chronically underfunded, and demand is suppressed because of low pay. As
long as wages stay suppressed and nurses continue to choose other
employment settings, this situation will not change. As we heard from
one respondent to a survey we conducted, “Due to the low starting pay for nurses
at the health department (those without public health experience) and
the low pay in general it is hard to recruit nurses to come and work at
the health department. They can make twice as much almost working at the
hospital or a nursing home.”
Another key consideration is that the model reflects what we call a
“baseline scenario”—or what supply and demand would look like if nothing
else changes. The data presented in this brief also represent what
shortages and surpluses would look like based on historical trends in
supply and demand. However, we know that the pandemic has affected the
nursing workforce and that future state and federal policy interventions
are also likely to influence future supply and demand. Different
scenarios were generated from NC Nursecast to estimate how changes such
as nurses exiting early from the workforce, increased training program enrollments, and growing
competition for nurses from other states may affect the future nursing
workforce. Findings from these forecasts can be found in our brief about alternative “what if” scenarios.
This brief has demonstrated just a few ways that NC Nursecast can be
used to understand workforce forecasts for RNs and LPNs by setting and
region in North Carolina. Model users can also analyze the data by AHEC
and rural regions of the state, as well as other employment
settings.
More detailed information about individual settings can be accessed in the model documentation. It is also
important to note that the data used in Nursecast originate from
self-reported information nurses provide as part of a biannual license
renewal process through the NC Board of Nursing. These data represent a
complete census of nurses in the state; longitudinal trends in NC nurse licensure data are available in the NC
Health Professions Data System (HPDS) at the Sheps Center.
Fraher EP. Primary Care Teams: Past, Present and Future. J Am Board Fam Med. 2020 Jul-Aug;33(4):495-498. doi: 10.3122/jabfm.2020.04.200260. PMID: 32675259. ↩︎
Ehrenberg RG and Smith RS. 2017 Modern Labor Economics. New York: Rutledge. ↩︎
“The Nursing Faculty Bottleneck.” Higher Ed Works. July 21, 2021. Article and video.“ NC is paying for neglecting nurses and teachers. It’s about to get worse”. News & Observer Editorial Board. September 3, 2021. ↩︎
>
Explore
Supply & Demand
Want to learn about the future supply and demand of our state's licensed practical
nurses and registered nurses across settings and geographic regions?
This project is brought to you by The Cecil G. Sheps Center For Health Services Research at the
University of North Carolina in partnership with the North Carolina Board of Nursing.